

Manufacturing companies generate terabytes of sensor, machine, and supply chain data every day. But most teams still rely on traditional analytics dashboards that show what happened without explaining why or what to do next.
As a manufacturing company, your quality engineers, plant managers, and supply chain leads deserve faster, deeper answers from all that data.
In this guide, we’ll cover the role of manufacturing data analytics, the types that matter, the top tools, and how to pick the right platform.
The Role of Data Analytics in Manufacturing Industry
Every factory produces massive volumes of data from sensors, PLCs, ERP systems, and quality logs, but most of it sits untouched in warehouses.
Data analytics for manufacturing facilities turns raw production numbers into clear signals your team can act on, from predicting machine failures to pinpointing defect patterns across suppliers.
The real shift goes beyond collecting more data.
You need to close the gap between the data you have and the decisions you need to make.
Benefits of Data Analytics in Manufacturing
Your factory data holds answers you probably haven’t asked for yet.
Let’s see what you gain when analytics sits at the center of your operations.
- Fewer Unplanned Stops: Predictive models flag equipment wear before a breakdown happens, so your maintenance crew can schedule repairs during planned downtime. A single prevented failure on a bottleneck machine can save thousands of dollars in lost output.
- Tighter Quality Control: Analytics can trace defect spikes back to specific suppliers, raw material batches, or shift patterns. The tracing can happen in minutes, so your quality engineers can start acting on root causes promptly.
- Leaner Inventory: Demand forecasting models help you carry the right stock at the right time, cutting carrying costs while reducing the risk of overproduction.
- Lower Energy Costs: Sensor data helps your team identify machines that consume more energy than they should, enabling you to trim utility bills without reducing throughput.

Types of Manufacturing Analytics and What Each Delivers
Your team needs a mix of analytical approaches, and the right one depends on whether you want to understand the past or shape the future.
Let’s break down each type.
- Descriptive Analytics: As the starting point for most companies, this type focuses on “what happened” through KPI dashboards, shift reports, and OEE summaries. You see trends, but you can’t dig deeper without help from the data analysts.
- Diagnostic Analytics: One level deeper, this type tackles “why did it happen” by correlating variables across machines, shifts, and suppliers. For example, your team can discover that defect rates climb when a specific raw material lot enters the line.
- Predictive Analytics: This forward-facing type is built around “what will happen next”. It relies on historical patterns and ML models that forecast equipment failures or quality drift before they hit your bottom line.
- Prescriptive Analytics: This is the most advanced of the traditional tiers, aimed at “what should we do”. It recommends specific actions like adjusting a machine parameter or rerouting a supply order based on modeled outcomes.
- Proactive Analytics: As an emerging category, proactive analytics goes further by automatically monitoring your data and surfacing insights before you even ask. With proactive analytics, your team gets alerts on anomalies, trend shifts, and KPI changes without submitting a single request.
Most legacy BI tools cap out at descriptive reporting. Manufacturers that pull ahead combine all of these types into a single analytics agent platform.
Big Data Analytics in Manufacturing
The scale of factory data is growing faster than most teams can handle. The big data analytics in the manufacturing market reached roughly $7.3 billion in 2025 and is on pace to nearly double by 2030.
What makes big data analytics for manufacturing unique is the sheer volume and variety.
Your factory simultaneously generates sensor readings every millisecond, quality images, ERP records, logistics feeds, and maintenance logs.
When you connect these streams, your team can spot patterns that a single source or analysis could never reveal independently.
Let’s say your supply chain team correlates raw material delivery data with quality outcomes. They discover that one supplier accounts for 40% of your rework costs.
The pattern would have stayed hidden for months without data analysis across your manufacturing systems.
The challenge is getting the right answers without overwhelming your manufacturing data analysts.

Manufacturing Data Analysis Use Cases
Your manufacturing floor, warehouse, and supply chain hold data that can drive immediate impact.
Manufacturers often see the fastest returns from the following use cases:
- Predictive Repairs and Maintenance: Sensor data from vibration monitors, temperature gauges, and current draws can show early signs of wear and tear. You can use the data to schedule repairs before a failure stops the line, and preventing even one stoppage often saves 10x or more than the cost of a reactive fix.
- Root Cause Analysis for Defects: Your quality engineers can use AI agents for data analysis to investigate defect patterns across one or multiple plants. If scrap rates spike, you can use analytics to trace the issue back to a specific machine setting, operator shift, or supplier batch in minutes.
- Supply Chain Forecasting: Demand models reduce excess inventory while preventing stockouts and correlating logistics delays with production schedules.
- Energy Optimization: Correlating energy use with machine output helps your team find equipment that wastes power during idle periods.
Manufacturing Data Analytics Tools
Your analytics platform determines whether your team gets answers in seconds or waits days for a custom report.
Here are the top manufacturing data analytics tools that serve the industry today:
1. Zenlytic
Zenlytic is an analytics agent platform that gives everyone in your organization the ability to ask questions in plain English and get trusted answers from your warehouse data.
Zoë, the AI data analyst at the core of Zenlytic, handles complex questions like “Which suppliers have the highest defect correlation across our 5 plants?” and explains every step of her reasoning.
Zoë stands apart from legacy BI and bolt-on AI tools because of its trustworthy answers.
Here’s what powers that trust:
- Clarity Engine: The Clarity Engine combines the depth of SQL with the governance of a semantic model, learning your metric definitions automatically as your team asks questions.
- Citations: This feature shows full data lineage for every number, which helps your team verify any result independently.
- Memories: With Memories, you can lock in definitions with a single click, which ensures the same question always produces the same answer.
- Clarity Admin: Your data team can review every dynamic field Zoë creates and promote the most valuable ones into your permanent model.
- Patterns: With Patterns, your team can sync Zoë with existing query history and start asking questions in minutes, because she learns your business context from real analysts, data build tools (dbt), and BI queries.
Manufacturers that choose Zenlytic today are early adopters of a fundamentally different approach to analytics. Analytics agents are becoming the industry standard, and Zenlytic is leading that shift with answers your teams can trust.
Schedule a free demo today and get from raw data to trusted answers in seconds.
2. ThoughtSpot
ThoughtSpot is a search-based analytics platform that allows users to query data using keywords. For manufacturers, it can surface production KPIs and trend reports.
The main consideration is that search accuracy depends on extensive upfront data modeling and synonym management. Your data team carries a heavy burden of setup before business users see value.
SpotIQ, ThoughtSpot’s automated insights feature, can surface anomalies in your data. For deeper follow-up questions about root causes and multi-step analysis, however, your team will likely still need an analyst involved.
3. Power BI
Microsoft’s Power BI is one of the most widely used reporting tools in manufacturing, especially for teams that use the Microsoft ecosystem already.
The Copilot AI feature adds natural language queries, but it operates as AI layered on top of BI. As such, deeper exploratory questions still require technical skills that most plant managers lack.
For organizations with an existing Microsoft 365 investment, Power BI integrates easily with Excel, Teams, and SharePoint.
Copilot’s accuracy, however, depends heavily on well-structured semantic models that your data team must build and maintain.
4. Tableau
Tableau excels at visualization and lets your team build polished dashboards for shift-level reporting and OEE tracking.
You’ll see the gap when your team tries to ask follow-up questions or investigate root causes beyond what the dashboard was designed to show.
Salesforce’s Einstein AI layer adds natural language queries, but the experience remains dashboard-centric.
For manufacturers that need to trace a defect pattern across 3 suppliers and 7 production lines, the tool often hits a ceiling.
5. Databricks AI/BI Genie

Databricks AI/BI Genie lets your engineers query data through a conversational interface on the Databricks Lakehouse.
If you’re already running Databricks for data engineering and ML workloads, Genie adds a natural language layer.
The tool is designed for technical users, which means your plant managers and quality leads may still depend on the data team.
Genie leverages Unity Catalog for governance, which ensures your existing permissions carry over. The learning curve for business users, however, can be steep.
6. Snowflake Intelligence
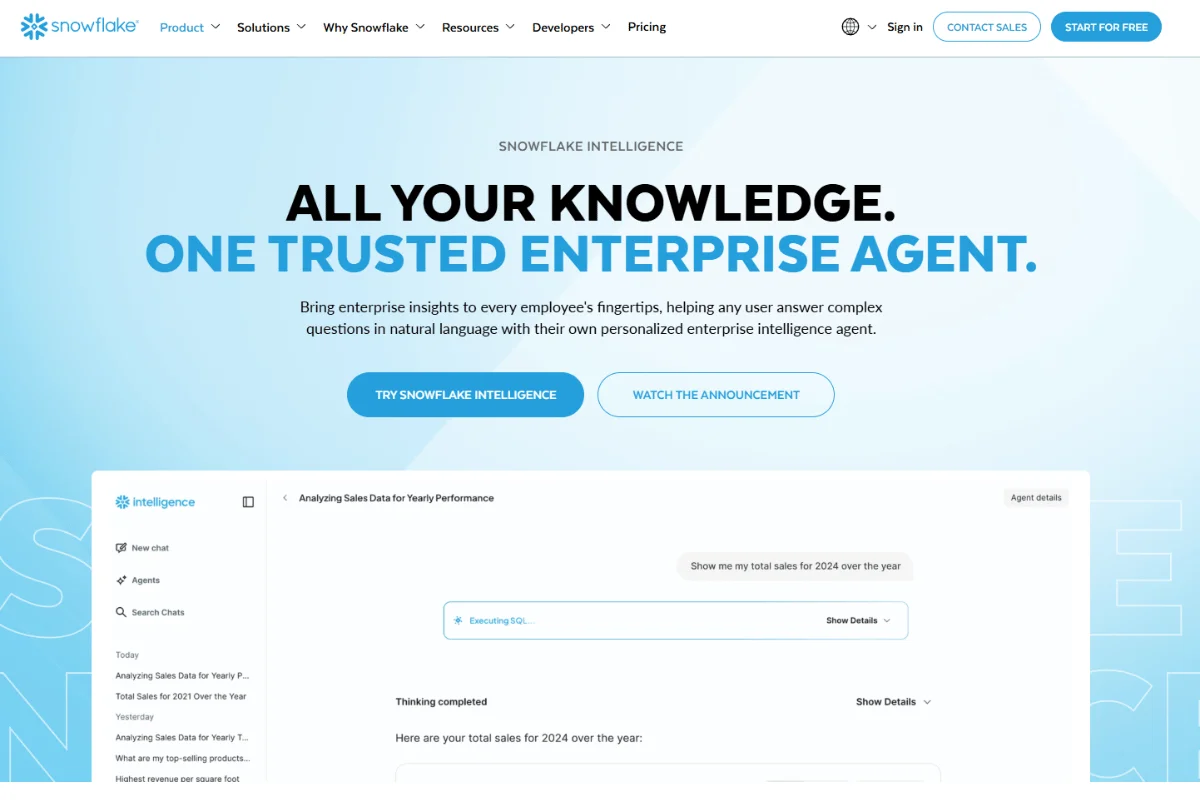
Snowflake Intelligence adds a conversational AI layer to the Snowflake Data Cloud. Your data team must build and maintain semantic views before business users see value, and the reasoning behind answers can be difficult for non-technical users to verify.
Everything runs within Snowflake’s governance boundary, so your data never leaves the perimeter. The per-token and per-index cost model, however, can escalate once you roll out access to hundreds of users across multiple plants.
The right pick depends on your team’s technical maturity, your warehouse setup, and whether you need a reporting tool or a true analytics agent.
Data Analytics in Manufacturing Case Study
Numbers and real outcomes make the case clearer than any feature list, which is why social proof is important.
Here’s a customer success story that speaks directly to manufacturers.
Stanley Black & Decker, one of the world’s largest tool and industrial equipment manufacturers, used Zoë to simulate the impact of different raw-material tariff levels on its margins.
Because the team could model those scenarios in real time, they understood the impact on their business earlier than their competitors and took proactive steps.
Matt Griffiths, the CTO of Stanley Black & Decker, had this to share:
“We already had a dozen tools that could tell us our sales last week. But only Zenlytic can answer the questions dashboards can’t. Zoë handles those high-impact questions that would be impossible to ask in traditional data platforms.”
Decision Criteria for Manufacturing Data Analytics Software
Picking the right platform means matching your organization’s needs to the tool’s core strengths.
Here are the criteria that matter most when you compare manufacturing analytics software.
- Trust and Explainability: Can you see exactly how every number was calculated, down to the tables, fields, and logic? Without explainability, your team won’t adopt the tool as you’d like.
- Governance and Security: Does the tool enforce row and column-level access to ensure every user only sees authorized data?
- Warehouse Compatibility: Ensure the platform can connect to your cloud warehouse (Snowflake, BigQuery, Databricks, or Redshift) without forcing you to duplicate data.
- Natural Language Access: Can your non-technical team members ask questions without writing SQL or submitting tickets?
- Speed to Value: How many weeks before your business users can ask questions? Platforms that demand months of semantic modeling delay ROI.

Frequently Asked Questions (FAQs)
Here are answers to the most common questions about data analytics for the manufacturing industry.
What is the Average Budget for Manufacturing Data Analytics Projects?
Mid-market manufacturers typically spend $100,000 to $500,000 per year on analytics platforms, while enterprise manufacturers with multiple plants often allocate $500,000 to $2 million per year.
Your budget should account for both the platform cost and the time your data team spends on setup.
How Long Does Data Analytics for Manufacturing Deployment Take?
Legacy BI tools often require 3 to 6 months of dashboard development and semantic modeling before your business users see any value.
Modern analytics agents like Zenlytic can sync with your existing query history and have your team asking questions in a few days.
The gap in time-to-value can mean the difference between acting on a problem and missing it entirely.
What Industries Lead The Big Data Analytics in Manufacturing Market?
According to the Mordor Intelligence report linked earlier, the automotive industry led with 28.5% market share by end user in 2024.
Electronics and semiconductor producers also had promising prospects at the top of the industry, with an expected compounding annual growth rate of 15.3% to 2030.
Aerospace and pharmaceutical manufacturers are also growing fast because of strict quality requirements and the need for real-time traceability.
How Do CFOs Evaluate Big Data Analytics for Manufacturing Investments?
Your CFO will look at time-to-value, total cost of ownership, and the measurable impact on downtime, scrap rates, and labor efficiency.
The strongest business case comes from showing how analytics reduces your data team’s ad hoc workload.
If you can cut the workload by 60% or more, you’ll be well ahead of many competitors.
Conclusion
Manufacturing data analytics has moved well beyond dashboards and static reports.
The manufacturers that win are the ones giving every team member, from the quality engineer on the floor to the VP of supply chain, direct access to trusted, explainable insights from their warehouse data.
Zoë delivers on this promise with the Clarity Engine for governed, explainable answers, Citations for full data lineage, and Memories for consistent results every time. Your engineers, managers, and executives get from question to confident action in seconds.
Book a demo today to see how Zoë turns your manufacturing data into faster, trusted decisions.