
.jpg)

If you're a manufacturing operations leader wondering whether data analytics can reduce costs in manufacturing plants, the short answer is yes.
The right analytics tool turns your sensor, ERP, and quality data into specific answers about where money leaks across maintenance, energy, labor, and your supply chain.
This article breaks down where analytics delivers the most value, which tools deliver it, and the pitfalls to avoid.
Can Data Analytics Reduce Costs in Manufacturing Plants?
Data analytics reduces manufacturing costs across maintenance, energy, labor, procurement, and waste when you convert raw operational data into specific, actionable insights.
You can spot which machine will fail before it breaks down, which shift burns the most energy per unit, and which supplier's quality gaps inflate your rework rate.
Siemens' True Cost of Downtime 2024 report found that companies using predictive maintenance reduced downtime by up to 50%. The pattern repeats across energy, labor, and procurement, indicating that manufacturers with better data visibility consistently operate at lower costs.
Such benefits mean that if you put analytics to work correctly, you can quickly recover your investment.
But the type of tool matters.
Your IoT sensors, ERP systems, and quality checkpoints produce massive volumes of data every day.
Legacy BI dashboards only show you what happened last month, though. They won't tell you why your scrap rate spiked on a Tuesday afternoon, or that the machine on Line 4 is trending toward a failure that could cost you $25,000 or more per hour in downtime.
Data analytics agents, a newer breed of AI-powered tools, handle these deeper queries by design. Early adopters in manufacturing, including Stanley Black & Decker and Eaton, already use them to shift from reactive reporting to proactive cost management.
5 Ways Data Analytics Reduces Manufacturing Costs
Cost savings from analytics keep compounding across your entire facility and supply chain, often in areas you might not expect.
Here are 5 categories where the impact shows strongly.
1. Predictive Maintenance That Prevents Downtime: Your equipment generates vibration, temperature, and pressure data around the clock. Predictive maintenance analytics flag failures before they happen, so you can replace a $200 part on your terms and avoid a $50,000 unplanned shutdown.
Siemens' True Cost of Downtime 2024 report linked above found that unplanned downtime drains $1.4 trillion from the world's 500 largest companies each year.
2. Labor and Workforce Costs: Your teams aren't free, and neither is overtime. With the right analytics platform, you can see how labor hours correlate with output, which shifts produce the highest yield, and where challenges reduce your workers' productivity or force them into low-value work.
3. Energy Spend Across the Facility: Energy is one of the most controllable costs in your plant, yet most manufacturers lack visibility into where waste occurs. You can use an analytics platform to track consumption by machine, shift, and product line to find the equipment or schedules that consume the most power.
4. Procurement and Supply Chain Costs: Your margins feel every lead time delay and change in a supplier’s prices. Supply chain analytics let you compare how different vendors perform and catch cost trends before they erode your profit margins.
5. Waste and Quality-Related Costs: Each month, you may have to deal with increasing hidden costs in the form of scrap, rework, and product defect rates. You need an analytics tool that can trace defects back to specific machines, product batches, or raw material lots. The results give your quality team the specifics to act fast.
When you implement data analytics correctly, the combined effect across these 5 areas creates structural savings that grow as your data matures.
Manufacturing Data Analytics Tools That Enable Cost Reduction
The platform you choose determines whether your analytics effort saves money or stalls out. Here's how the top tools stack up when it comes to manufacturing cost reduction.
1. Zenlytic
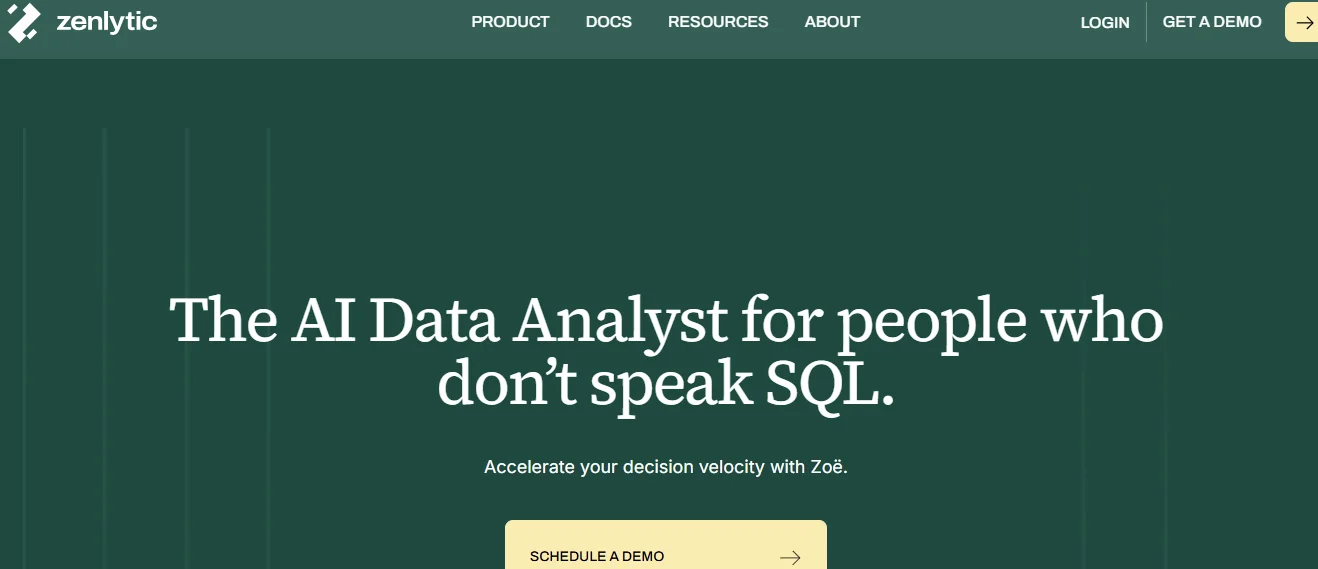
Zenlytic is an AI-native analytics agent platform built to deliver trusted answers from your data without any SQL.
Zoë, the platform's agentic analyst, connects to your cloud warehouse and answers complex queries in plain English.
For manufacturers, Zenlytic stands out because of its focus on trust and depth.
Here’s a real-life scenario where a manufacturer benefited from using Zenlytic.
When tariff uncertainty swept through the manufacturing sector, Stanley Black & Decker turned to Zoë to model how various raw material cost scenarios would affect its margins.
The company understood the financial exposure months before its peers did. While competitors announced workforce cuts that summer, the company kept their entire team intact.
Matt Griffiths, the CTO of Stanley Black & Decker and the 2024 Snowflake CDO of the Year, shared:
"We already had a dozen tools that could tell us our sales last week. But only Zenlytic can answer the questions that dashboards can't. Zoë handles those high-impact questions that would be impossible to ask in traditional data platforms."
So, how do Zoë's trust pillars apply to your manufacturing plant? Here’s how:
- Accuracy Through the Clarity Engine: Zoë maps every query into your governed data definitions through the Clarity Engine. For example, a plant manager who tracks cost per unit across 3 facilities gets the right tables and correct joins without touching SQL.
- Consistency Because of Memories: Zoë’s Memories locks in your metric definitions with a single click. Once you define "yield" as first-pass yield excluding rework, every person on your team gets the same answer every time.
- Full Explainability With Citations: Every number Zoë returns links back to its source table, column, and formula through Citations. Your quality team can verify a scrap cost figure in seconds without having to audit a 500-line SQL statement.
- Rapid Setup Through Patterns: Zoë’s Patterns indexes your existing query history, including dashboards, SQL queries, and notebooks. The agent takes minutes instead of months to learn how your team uses data.
- Connected Documents as Branded Artifacts: Zoë generates presentations, financial models, and data apps as Artifacts. All the branded artifacts stay connected to your warehouse, refresh on schedule, and export as .docx, .xlsx, and .pptx files.
- Depth for Complex Queries: Zoë handles multi-step questions that no dashboard could answer, such as "Which supplier's material variance contributed most to our margin decline in Q4 across our 5 plants?"
- Governed Access at Every Level: You get row-level and column-level controls that ensure your team members only see the data you authorize them to see. Your plant supervisors see their own facility's data, while the executives see the full data across multiple facilities.
Your hardest manufacturing question deserves a trusted answer. Schedule a free demo to get started with Zenlytic today.
2. ThoughtSpot
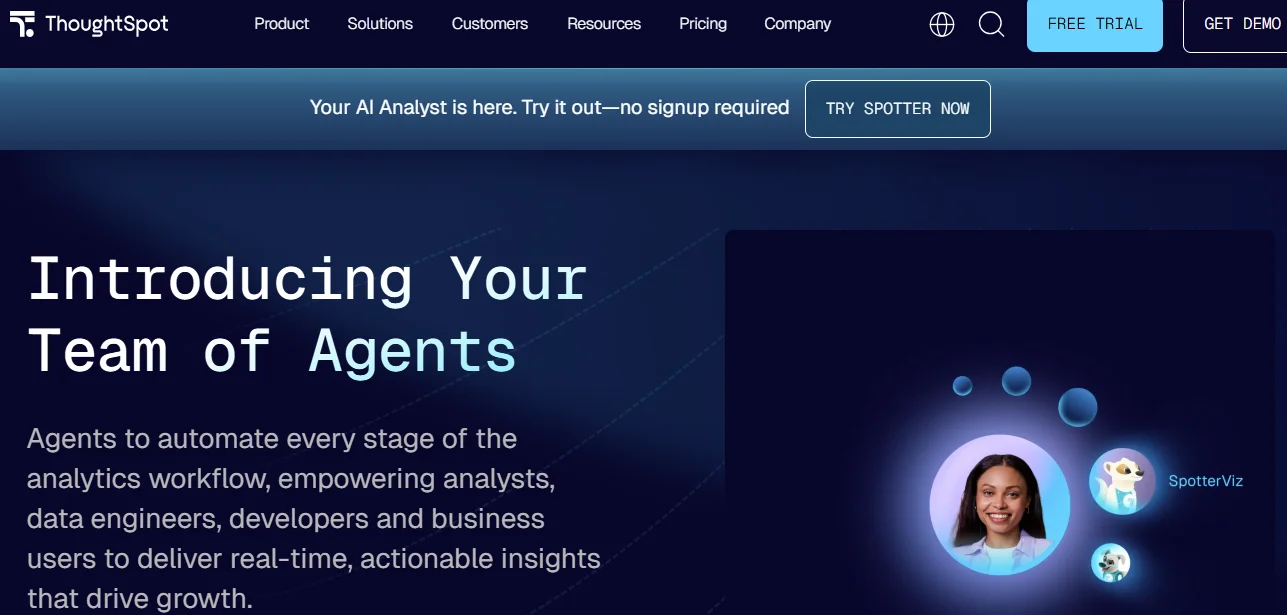
ThoughtSpot centers on a search-first experience where users type keywords to pull up charts and visual summaries on demand.
Manufacturers with technically skilled teams can use it to surface operational metrics quickly based on various keywords.
The platform’s search accuracy depends on extensive upfront data modeling and synonym management, though, so you'll need a dedicated admin to keep the index current.
When you compare ThoughtSpot and Zenlytic in terms of search-based and agent-based analytics, you notice the gap when it comes to complex, multi-step queries.
For teams with clean, well-modeled data and comfort with keyword-driven exploration, ThoughtSpot can work well.
But the search paradigm can feel limited when your questions require deeper context or conversational follow-ups.
3. Tableau
Tableau has built a strong reputation for transforming structured data into interactive visual reports.
Manufacturing teams often use it for OEE tracking, shift performance views, and quality trend analysis.
Your analytics team has to do all the dashboard creation, modeling, and performance tuning.
For ad hoc questions about why a defect rate spiked or how to optimize changeover schedules, you'll typically need an analyst to build a new view.
4. Power BI
Power BI sits at the center of Microsoft's data ecosystem, with tight connections to Azure, Excel, and Teams.
Manufacturers who use the Microsoft stack get a familiar interface and broad connectivity to cloud and on-premise data.
The Copilot features add natural language querying, but they layer AI on top of a traditional BI framework.
For deeper manufacturing data analytics, you'll still lean on your data team to build the models behind every report.
5. Databricks AI/BI Genie
Databricks Genie AI/BI provides a natural language interface that allows users to query the Databricks Lakehouse directly.
Manufacturers who already run Databricks can explore production and supply chain data through conversation.
The platform has a deep ecosystem integration, but Genie's AI performance depends on how well your Unity Catalog is configured.
You can also expect better results if you're locked into Databricks as your warehouse.
As more manufacturers move toward AI-driven analytics, the key question isn't whether AI can help your plant. Your greater concern will be whether the platform you choose can earn your team's trust.
You can get more trustworthy answers when using AI data analytics agents than with tools that layer AI on top of BI. The latter usually lack the in-depth semantic layer that helps produce consistent, correct answers based on brand-specific context.
As Reddit user Skueeeeee_D notes in a discussion on how BI tools are using AI:
“AI is hard for most BI tools because most of the time, BI tools don’t have the context for AI to get close to the right answer. It was said earlier, but AI is non-deterministic, so you can’t guarantee a consistent result every time, but by providing AI enough guardrails, you can get close. To do this, you really need a semantic layer or some guiding source.”
Implementation Framework for Cost Reduction in Your Plant
The right tool won't save money on its own. You need a clear path from data to results.
Here's a handy cost reduction framework that works for manufacturers:
- Start With One High-Cost Area: Pick the cost category with the most waste, whether that's unplanned downtime, energy, or scrap. Focus your first analytics project on it for the fastest returns.
- Connect Your Cloud Warehouse: You can centralize ERP, sensor, and quality data in platforms such as BigQuery, Databricks, or Snowflake. Most modern warehouses connect to analytics tools with minimal pipeline work.
- Define Your Metrics Up Front: Before you ask a single question, lock in how your team defines "yield," "OEE," and "cost per unit." Consistency here prevents conflicting numbers later.
- Roll Out to Business Users First: Your plant managers and quality leads are closest to the problems your manufacturing operations encounter. Give them access to a tool they can use without SQL, and you'll start getting answers on day one.
- Measure and Expand: Track the savings from your first use case, then expand to the next cost category. Each win builds the case for broader adoption across your facilities.
Common Mistakes to Avoid
You can invest heavily in analytics, but it's likely to fail when your teams repeat the same avoidable errors.
You'll want to watch for the following common issues during the rollout.
1. The "Perfect Data First" Trap: Many data teams believe they need a complete data transformation project before AI can deliver value. They don't. The "build it and they'll come" mindset delays ROI by months.
Provided your data is clean, you can start with it and have the platform you’ll choose learn over time.
Here’s a recommendation by UnoMaconheiro in a Reddit discussion on being held back from insights due to data-related issues:
“The problem isn’t that you have too much data. It’s that it’s scattered and unstructured. Start by figuring out what metrics actually matter and focus on those. Limit dashboards to the stuff people actually use. Make sure everyone knows where each data point comes from so you stop chasing ghosts. Automate updates wherever you can so reports aren’t stale. Clean up redundant sources and map relationships between them. Once you have that foundation, your dashboards start being useful instead of chaotic. After that, you can think about tools.”
2. Selecting a Tool Your Business Users Can't Operate: If your plant managers need to file a ticket every time they have a question, adoption will collapse. Pick a platform built for non-technical users who need trustworthy answers fast.
3. Unclear Metric Standards: When 3 people on your team define "downtime" in 3 different ways, every report becomes a debate. You must lock the right definitions into the platform’s semantic layer from the start, even as the system keeps learning and making suggestions.
4. The One-Time Project Mindset: Cost reduction requires ongoing monitoring rather than a quarterly report, which means you need to build analytics into your daily rhythm.
These mistakes are common because traditional BI tools never addressed them satisfactorily. An analytics agent approach, where the platform learns your definitions and enforces consistency, helps you sidestep them from day one.
Metrics to Evaluate Cost Reduction Impact
Proving ROI requires you to set the right KPIs even before you choose and start using the data analytics tool.
Below are the metrics that matter most when you track your analytics ROI in manufacturing.
- Overall Equipment Effectiveness (OEE): This metric measures availability, performance, and quality in a single score. You want to see this number climb after you deploy analytics.
- Unplanned Downtime Rate: Track how often and how long unplanned stops occur. A strong analytics platform should help you drive this number down within the first quarter.
- Cost Per Unit Produced: Compare your pre-analytics and post-analytics cost per unit while factoring in energy, materials, labor, and waste.
- Mean Time Between Failures (MTBF): Predictive analytics platforms should extend the average gap between equipment failures as your data matures.
- Scrap and Rework Rate: This metric directly indicates the level of quality improvement. You should see a measurable decline as your team uses analytics to trace root causes back to specific machines or material lots.
Your finance and operations teams should review these metrics monthly and tie them to specific analytics efforts. Without that link, proving ROI turns into guesswork.

Frequently Asked Questions (FAQs)
Here are answers to the most common questions manufacturers ask about data analytics and cost reduction.
How Long Does It Take to See Cost Savings From Analytics?
Most manufacturers see initial savings within 60 to 90 days, especially with a focused use case.
High-frequency areas such as predictive maintenance and energy monitoring deliver the fastest returns.
You can expect broader results across your supply chain and labor to emerge within 6 months as your data matures.
What Type of Data Is Required for Factory Cost Analysis?
You'll need data from your IoT sensors (vibration, temperature, pressure), your ERP system (production orders, inventory, procurement), and your quality management systems.
The more sources you connect to your cloud warehouse, and the cleaner your data is, the richer your insights become.
Can Multi-Plant Groups Use Centralized Analytics?
Yes, multi-plant groups can use centralized data analytics.
A centralized platform connected to your cloud warehouse lets you compare performance across every facility.
You can benchmark OEE, energy costs, and scrap rates by plant and surface best practices for the rest of your network.
How Often Should Factory Cost Data Be Reviewed?
Your team should review core cost metrics weekly at a minimum.
Dedicate daily attention to high-frequency areas such as downtime and energy, and monthly reviews for supply chain and procurement trends.
Conclusion
Manufacturers that invest in data analytics can reduce costs in manufacturing plants across maintenance, energy, labor, and supply chain departments.
The facilities that move first by implementing the right analytics tool build structural and strategic advantages that their competitors can't replicate easily or in time.
Zenlytic's Zoë gives your team accurate, consistent, and fully explainable answers to the complex questions your dashboards were never built to handle.
Every number comes with complete data lineage, every metric stays locked in through Memories, and every user gets governed access without needing SQL.
Book a demo today to start asking Zoë your hardest questions based on your own data.